Sidebar
Table of Contents
Vampir
VampirTrace is a tool for inspecting Trace-files (in Open Trace Format) of parallel applications. It allows users to perform analysis on performance problems and understand bottlenecks in their parallel programs. In the context of parallel-I/O Vampir can help finding out if and where I/O is actually a bottleneck in your program.
Usage
Compile your program with the Vampir Compiler to enable writing of trace files:
vtcc you_file.c
The program is executed in the usual way. Running it produces a trace-file that can be opened in the Vampir gui.
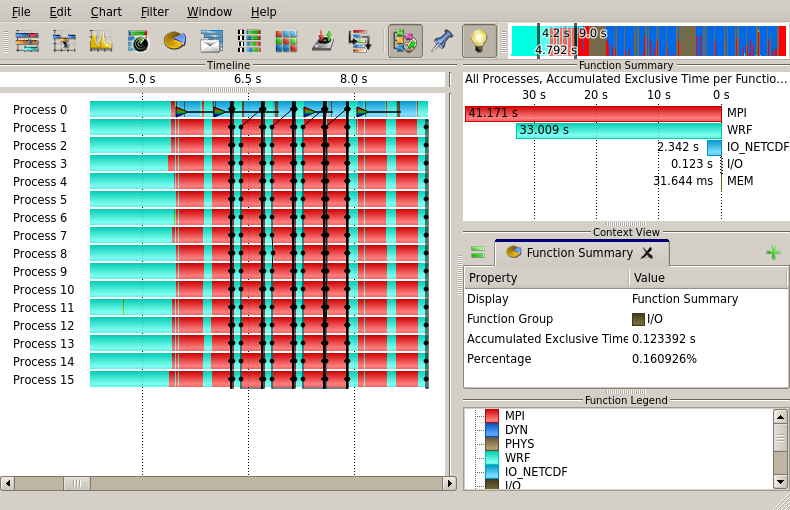
As pictured below Vampir displays a timeline and a 'Function Summary' showing which parts of the program take the longest. Using the function summary it is possible to see whether I/O actually takes up a large part of the programs running time. The timeline allow the user to inspect whether processes wait for I/O operations to finish.
vtcc is only a wrapper around a compiler, this allows us to switch out the underlying compiler when needed. This makes it possible to compile mpi-applications with tracing enabled.
vtcc -vt:cc mpicc
The Vampir GUI offers a variety of other functionality to analyze your programs I/O behavior. Check out the official documentation!


